Midday Market Check-In: An In-Depth Look at Market Movements and Investor Sentiment
Midday Market
Introduction: The Value of a Midday Market Check-In
Every trading day has its own rhythm. Morning news sets the tone, early flows reveal the mood, and then midday trading offers a critical pulse check. A midday market check-in isn’t just a quick glance at a ticker; it’s an analytical pause that helps investors recalibrate positions, gauge sentiment, and understand what might unfold by the closing bell.
In this article we’ll explore why midday analysis matters, how to structure a check-in, what to watch for in indices, sectors, and macro drivers, and how investors and traders can use midday signals to refine their strategies.
Closing Bell Recap: Key Takeaways
Why Midday Matters
1. Market Psychology Evolves After the Open
Opening bell volatility often reflects pent-up overnight orders, headlines, and investor emotion. By midday, that rush settles. Prices stabilize, liquidity deepens, and a clearer picture of supply and demand emerges.
2. Early Indicators for the Afternoon Session
A midday market check-in can reveal whether morning moves are sustainable. Does the rally have breadth? Are declines deepening? Is volume supporting the move or fading? These insights help shape expectations for the closing session.
3. Economic Data Timing
Many major data releases occur at 8:30 a.m. ET or 10:00 a.m. ET. By midday, the market’s digestion of those numbers is evident. This is a sweet spot for assessing how data truly landed with investors.
4. Corporate Announcements & Breaking News
Earnings calls, M&A headlines, or regulatory developments can hit mid-morning. A midday analysis captures how stocks and sectors are actually responding once the dust settles.
Anatomy of a Midday Market Check-In
To make your check-in comprehensive but manageable, think of it as three layers: the indices, the internals, and the context.
1. Indices Snapshot
Begin with the headline numbers:
- Major Indices: S&P 500, Dow Jones Industrial Average, Nasdaq Composite, Russell 2000, or regionals depending on focus.
- Percentage Changes: Report the move from the prior close, not just points.
- Highs vs. Lows: Is the index near the morning’s high or low of day?
Example (hypothetical):
At midday, the S&P 500 is up 0.6%, the Dow is flat, and the Nasdaq is climbing 1.1%, suggesting tech leadership.
2. Sector Rotation
Markets rarely move uniformly. Check ETFs or sector indices:
- Leaders and Laggards: Which sectors are outperforming? Energy, Financials, Tech, Healthcare?
- Themes: Are “defensive” groups (utilities, consumer staples) gaining ground, or are “cyclical” groups leading?
This helps identify underlying market tone — risk-on or risk-off.
3. Market Internals
Internals give depth beyond the index moves:
- Advancers vs. Decliners: Breadth metrics from NYSE and Nasdaq.
- New Highs vs. New Lows: Gauges the underlying strength or weakness.
- Volume: Above or below average? Which side — buying or selling — dominates?
4. Notable Stock Movers
Highlight a handful of notable names with context:
- Earnings reactions
- Guidance surprises
- Upgrades/Downgrades by analysts
- News catalysts
Example: “At midday, Tesla shares are up 4% after unveiling a new battery technology, while JPMorgan slides 2% following softer loan growth commentary.”
5. Macro and Cross-Market Indicators
Beyond equities, look at:
- Treasury Yields: Rising or falling?
- Dollar Index: Strength vs. major currencies?
- Commodities: Oil, gold, copper — how are they behaving?
- Volatility Index (VIX): Rising fear or complacency?
Cross-market moves often presage equity trends in the afternoon.
6. Technical and Sentiment Signals
By midday, intraday charts can show whether:
- Support/Resistance Levels are holding
- Moving Averages are being tested
- Momentum Indicators like RSI or MACD are shifting
Sentiment check: social media chatter, options flow, or unusual put/call activity.
7. Forward-Looking Calendar
Include a note about upcoming events:
- Afternoon Data: Fed speeches, Treasury auctions
- Tomorrow’s Reports: CPI, payrolls, retail sales
- Earnings After the Bell: Key tech or financial names releasing results
Key Takeaways from Midday Check-Ins
1. Confirmation or Contradiction
Do midday readings confirm the morning trend or contradict it? For instance, a strong open that fizzles by noon may indicate fading enthusiasm.
2. Sector Leadership
Identifying which sectors sustain moves midday helps traders position for afternoon follow-through.
3. Momentum Strength
Volume and breadth at midday often foreshadow closing performance. A rally on thin volume may reverse; a decline on heavy selling could deepen.
4. Risk Signals
Spikes in the VIX, surging Treasury yields, or sharp moves in the dollar midday can warn of macro stress.
5. Short-Term Trade Adjustments
Day traders use midday analysis to set stops, take profits, or enter new trades based on clearer direction.
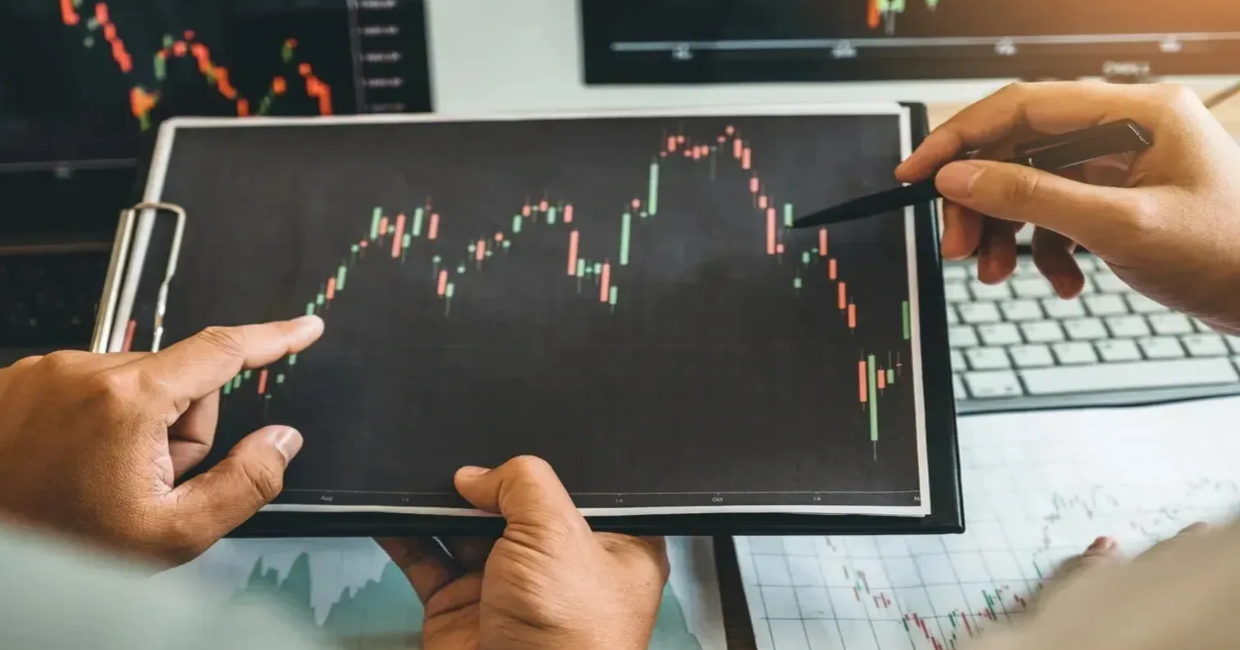
Hypothetical Example: A Midday Market Check-In Report
Below is a sample structure to illustrate how one might write a midday check-in.
Market Overview
By midday, U.S. stocks are mixed. The S&P 500 adds 0.3% after a morning slip, the Dow holds flat, and the Nasdaq outperforms with a 0.9% gain. Volume on both exchanges is modestly above the 20-day average.
Sector Trends
Technology and consumer discretionary stocks lead, buoyed by upbeat retail sales and a strong chipmaker earnings report. Utilities and healthcare lag as investors rotate into higher beta names.
Notable Movers
- Apple (AAPL) up 2% after reports of robust pre-orders for its latest device.
- ExxonMobil (XOM) up 1.5% with oil prices rising.
- Pfizer (PFE) down 1.8% after mixed trial data on a new therapy.
Macro Check
Treasury yields are ticking higher after a hawkish Fed governor speech. The dollar index is steady. Gold is flat at $1,950/oz, while crude oil trades up 0.8% at $83 per barrel.
Technical and Sentiment Notes
The S&P 500 remains above its 50-day moving average. The put/call ratio at midday indicates moderate bullishness. Options volume in semiconductor stocks signals continued enthusiasm.
Afternoon Watchlist
Traders eye the Fed minutes release at 2 p.m. ET and earnings from two major tech names after the bell.
Bottom Line
Midday tone is constructive but not euphoric. Sustained breadth in tech and consumer discretionary could drive an afternoon push higher if macro factors remain supportive.
Benefits for Different Types of Market Participants
Day Traders
They gain short-term signals about where momentum might carry into the close.
Swing Traders
They gauge whether to hold positions overnight based on how markets stabilize midday.
Long-Term Investors
They can monitor whether big picture trends remain intact, or if midday volatility hints at broader shifts.
Risk Managers
They get early warnings about possible end-of-day volatility or sector stress, helping to hedge portfolios more effectively.
Common Pitfalls to Avoid in Midday Analysis
Overreacting to Intraday Noise
Not every midday swing predicts the close. Thin liquidity or headline spikes can mislead.
Ignoring the Bigger Trend
Intraday moves should be contextualized within the daily, weekly, and monthly charts.
Cherry-Picking Indicators
Confirmation bias — focusing only on metrics that support your thesis — can skew decision-making.
Forgetting Cross-Asset Signals
Ignoring bonds, currencies, and commodities leaves blind spots in understanding equity moves.
How to Perform Your Own Midday Market Check-In
- Choose Reliable Data Sources: Reputable newswires, exchange data feeds, and professional charting platforms.
- Create a Checklist: Indices, sectors, internals, macro, notable stocks, forward events.
- Update Intraday: Record data at the same time each day for consistency.
- Compare Trends Over Time: Spot patterns in how midday behavior correlates with closes.
- Stay Objective: Let data guide your interpretation, not the other way around.
Incorporating Technology and Tools
Modern trading platforms make midday analysis easier:
- Heat Maps show sector performance visually.
- Breadth Indicators auto-calculate advances/declines.
- News Aggregators collect headlines in real time.
- Options Flow Trackers hint at institutional positioning.
Using these tools at midday gives a richer picture than end-of-day data alone.
Midday Check-In Around the World
While this article focuses on U.S. markets, the same logic applies globally. European equities see their midday when U.S. markets open; Asia has its own rhythm. Cross-time zone awareness can sharpen your edge.
Putting It All Together: A Midday Ritual
The best investors and traders develop rituals. A midday market check-in can be a cornerstone ritual:
- Pause Around Noon: Step back from the noise.
- Run Through Your Checklist: Indices, sectors, internals, macro, technicals.
- Journal Observations: Keep a log of midday impressions.
- Plan the Afternoon: Decide whether to adjust positions, hedge, or stand pat.
- Reflect Post-Close: Compare midday impressions with end-of-day outcomes to refine your skill.
Why Midday Market Check-Ins Will Remain Vital
Even with algorithmic trading and real-time dashboards, humans need context. A midday analysis gives a structured time to evaluate risk, opportunity, and sentiment — a pause in an otherwise non-stop information flow.
It also helps combat cognitive biases: by scheduling a disciplined review at a set time, you’re less likely to react emotionally to every blip on the screen.
Conclusion: Harnessing the Power of the Midday Market Check-In
Markets are dynamic, influenced by countless variables. But structure helps. A Midday Market Check-In transforms noise into insight. By evaluating indices, sectors, internals, macro factors, and sentiment halfway through the day, you equip yourself to make better-informed decisions for the afternoon session and beyond.
Whether you’re a professional trader, an institutional investor, or simply an engaged market enthusiast, making this midday ritual a habit can improve your clarity, discipline, and ultimately your results.