Market Watch Trendline: Data You Need

Market Watch Trendline
Introduction — Why “Trendlines” Matter
Financial markets are awash in data, but only some of it is truly useful for making decisions. A trendline is more than a charting tool — it’s a metaphor for tracking the ongoing narrative of prices, fundamentals, and sentiment. “Market Watch Trendline: Data You Need” is about identifying the most important data points, understanding their context, and acting on them intelligently. This article explores the key categories of data every investor should watch, why they matter, and how they fit together to form a reliable market trendline.
Market Watch Weekly: The Week Ahead
1. Understanding Trendlines Beyond the Chart
The Technical Definition
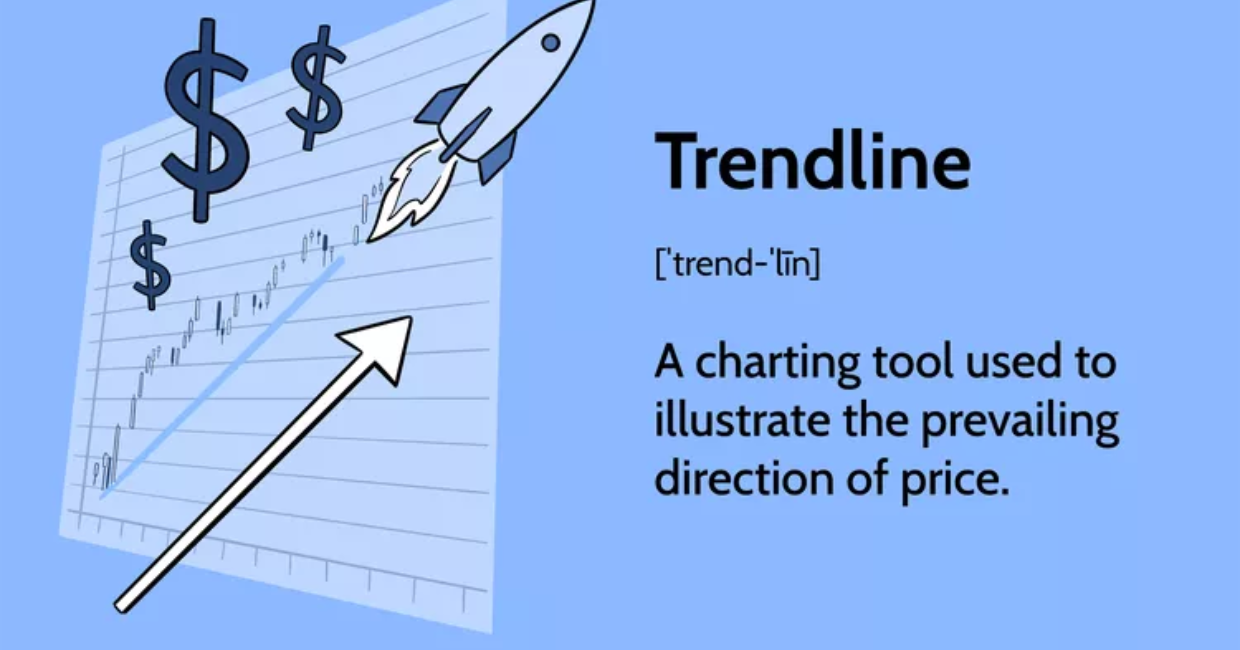
In chart analysis, a trendline connects a series of highs or lows to indicate direction and momentum. It reveals whether markets are in an uptrend, downtrend, or consolidation.
The Broader Application
A “trendline” of data is about observing consistent patterns — GDP growth, inflation, corporate profits, or investor positioning — to see where the market narrative is heading.
Why Investors Care
Trendlines smooth out the noise. By watching how data evolves over weeks and months, you gain insight into underlying conditions rather than reacting to every headline.
2. The Three Pillars of Market Data You Need
Macro Fundamentals
Economic growth, inflation, employment, and monetary policy form the backdrop for all asset classes.
Corporate Health
Earnings, margins, debt levels, and capital expenditures tell you how companies are navigating that macro backdrop.
Market Internals and Sentiment
Breadth, volume, volatility, and positioning show how investors are interpreting fundamentals and whether they’re overextended.
3. Macro Trendlines — The Economy’s Pulse
GDP Growth
Quarterly GDP is a lagging indicator but signals broad health. Look at real versus nominal growth and the contribution of consumption, investment, and net exports.
Inflation Indicators
Consumer Price Index (CPI), Producer Price Index (PPI), and the Fed’s preferred Personal Consumption Expenditures (PCE) gauge purchasing power and policy direction.
Labor Market
Non-farm payrolls, jobless claims, and wage growth reveal demand for workers and potential inflation pressures.
Business Activity
PMIs, ISM surveys, and regional Fed indexes show real-time conditions for manufacturing and services.
4. Central Bank Trendlines — Monetary Policy Signals
Federal Reserve
Rate decisions, dot plots, and press conferences anchor U.S. market expectations. Watch for pivot points between tightening and easing.
Global Central Banks
ECB, Bank of England, and Bank of Japan decisions shape currency moves and cross-border capital flows.
Balance Sheets
Quantitative tightening or easing affects liquidity conditions. Tracking central bank assets is as important as watching rates.
5. Corporate Earnings Trendlines — Micro Meets Macro
Revenue Growth and Margins
Trends in top-line growth and cost control show how well companies navigate inflation and demand swings.
Guidance and Analyst Revisions
Upward or downward guidance changes institutional investor positioning. Trendlines in revisions often lead price moves.
Sector-Level Insights
Tech, healthcare, energy, and consumer sectors each respond differently to macro conditions. Compare sector growth to index averages.
6. Market Internals — The X-Ray of Price Action
Breadth Indicators
Advance–decline lines, new highs versus new lows, and volume confirm or contradict index performance.
Volatility
The VIX measures implied volatility in options and serves as a “fear gauge.” Persistent low volatility can mask brewing risks.
Credit Spreads
Corporate bond spreads over Treasuries show risk appetite. Widening spreads often precede equity weakness.
Currency and Commodity Trends
Strong or weak currencies and commodity cycles affect profits, inflation, and investor rotations across asset classes.
7. Technical Trendlines — Reading the Tape
Support and Resistance
Horizontal trendlines mark price levels where demand or supply is strong. Breakouts often signal trend changes.
Moving Averages
50-day and 200-day moving averages smooth price action and serve as key support/resistance zones for traders.
Relative Strength and Momentum
Indicators like RSI or MACD help confirm whether a trend is strengthening or weakening.
8. Investor Sentiment Trendlines — Gauging the Crowd
Surveys
AAII, Investors Intelligence, and fund manager surveys reveal retail and institutional sentiment extremes.
Positioning Data
Futures and options positioning (CFTC data) can highlight crowded trades and contrarian opportunities.
Fund Flows
ETFs and mutual fund inflows/outflows indicate which sectors or regions are gaining traction.
9. Global Data Trendlines — Beyond Domestic Markets
International Growth
China’s industrial production, Europe’s inflation, and emerging-market PMIs shape global demand and supply chains.
Trade Balances and Currency Reserves
Shifts in trade flows and reserve holdings can foreshadow currency moves or policy changes.
Geopolitical Indicators
Defense spending, sanctions, and global conflict risk alter commodity and capital markets.
10. Alternative Data — New Frontiers for Trendlines
Satellite and Shipping Data
Monitoring port congestion or commodity stockpiles can offer leading signals.
Web Traffic and Consumer Behavior
E-commerce trends, app downloads, and social media sentiment reveal brand momentum before earnings.
ESG Metrics
Carbon footprints, board diversity, and regulatory compliance increasingly influence valuations and capital costs.
11. Building Your Own “Market Watch Trendline” Dashboard
Select Core Indicators
Pick a few key metrics from each category — macro, corporate, technical, sentiment — to avoid overload.
Update Weekly
Consistency matters more than scope. Track changes over time to spot inflection points.
Color Coding and Alerts
Use charts, heat maps, or dashboards to visualize trend direction and intensity.
12. Turning Data Into Insight — Not All Signals Are Equal
Correlation vs. Causation
Just because two trendlines move together doesn’t mean one drives the other. Focus on fundamentals.
Leading vs. Lagging Indicators
PMIs and credit spreads often lead, while GDP and earnings are lagging. Balance both for a full picture.
Cross-Asset Confirmation
Watch how bonds, equities, and commodities react to the same data point. Alignment adds confidence.
13. Case Study — Reading a Real-World Trendline
Imagine the following pattern:
- CPI easing for three months
- Jobless claims edging higher
- Fed signaling a pause
- Credit spreads narrowing
This trendline suggests a soft landing narrative. Equities might rally, but you’d also watch for late-cycle risks like margin compression.
14. Risk Management — When Trendlines Break
Stop-Losses and Hedging
Even the best data won’t prevent surprises. Define exit levels and hedge exposures.
Scenario Planning
Map out bullish, base, and bearish scenarios for key data releases to avoid emotional decisions.
Diversification
Multiple asset classes and geographies smooth portfolio volatility.
15. The Human Element — Interpreting Trendlines Wisely
Cognitive Biases
Confirmation bias and recency bias can distort how you read data. Use objective checklists.
Long-Term Vision
Trendlines over months and years matter more than day-to-day fluctuations for strategic investors.
Continuous Learning
Markets evolve; keep updating your framework to incorporate new metrics and tools.
16. Putting It All Together — Your Weekly “Data You Need” Routine
- Sunday Evening: Review upcoming economic releases and earnings reports.
- Monday Morning: Check overnight global markets, futures, and opening sentiment.
- Midweek: Watch how markets react to the biggest data point (CPI, Fed minutes, or earnings).
- Friday Wrap-Up: Update your dashboard trendlines, note surprises, and adjust scenarios.
17. Looking Ahead — Emerging Trendlines to Watch in the Next Decade
AI and Automation
Corporate adoption of AI tools will shape productivity and labor demand.
Climate Transition
Carbon pricing, renewable energy deployment, and supply chain shifts influence multiple asset classes.
Demographics
Aging populations, urbanization, and migration alter consumption patterns and fiscal policies.
Conclusion — Mastering the “Market Watch Trendline”
“Market Watch Trendline: Data You Need” is not about predicting the future with perfect accuracy. It’s about building a consistent, disciplined framework to interpret market signals. By identifying key data points — macro, corporate, technical, sentiment, and global — and tracking them over time, you create your own trendline of understanding.
This approach helps you:
- Filter noise from meaningful signals
- Anticipate inflection points
- Manage risk proactively
- Gain confidence in investment decisions
Trendlines remind us that markets move in narratives, not random walks. The more faithfully you track the data you truly need, the clearer the picture becomes — and the better your decisions will be.


